GhostQR / practical guides
Understand your QR code scans
Dynamic QR codes record visits through their short links. Use those scans to learn when and where your printed material draws a response.
What GhostQR shows
- Scan counts: activity today, over the last 30 days, and across the code's lifetime.
- Time trends: a daily chart for the last 30 days.
- Country: an approximate location inferred from the network connection, not a GPS location.
- Device: iOS, Android, or other, inferred from the request's browser information.
Open a dynamic code in your dashboard to view its analytics. A new code starts at zero. Static codes link directly to their destinations, so they do not produce GhostQR scan analytics.
Read a code's analytics
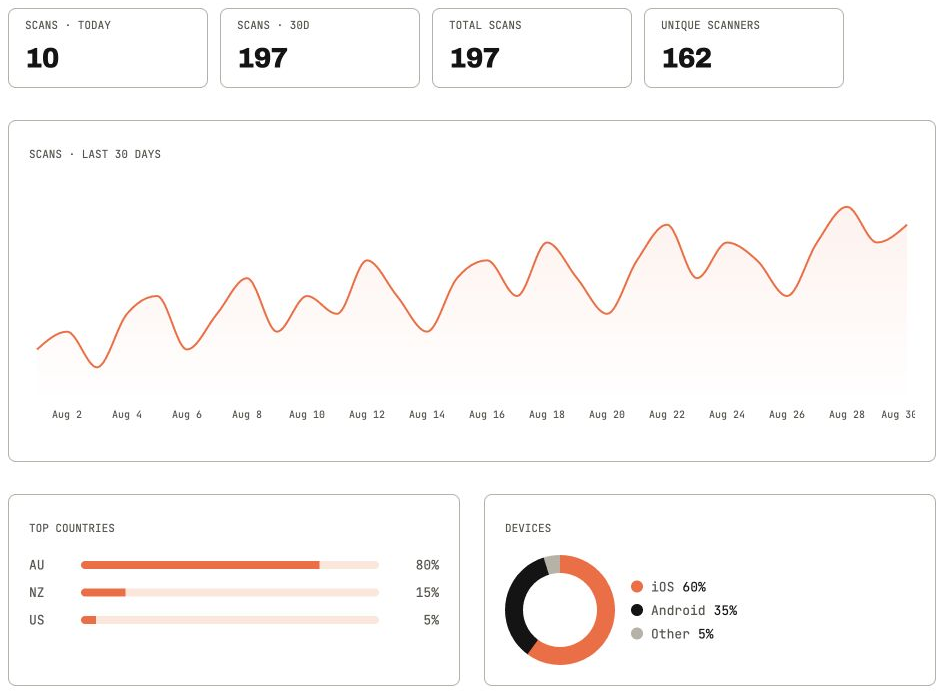
Product screenshot · illustrative sample data · select image to enlarge
This fictional campaign started within the displayed 30 days, so its 30-day and lifetime totals both show 197. These are example figures, not customer results.
- Scan counts
- Today, the last 30 days, and lifetime are different windows. Unique scanners is a lifetime estimate, not a count of known people.
- Scans · last 30 days
- Look for changes around a campaign launch or a new placement. The chart currently has a fixed 30-day window.
- Top countries
- These percentages describe scans in the last 30 days. Network location can differ from the scanner’s actual location.
- Devices
- This 30-day split helps you decide which phones to prioritise when testing the destination page.
Compare placements fairly
Create a separate dynamic code for each placement, such as a counter sign and a takeaway flyer. They can point to the same page while keeping their scan activity separate.
Compare them over the same period and account for how many people could see each code. Fifty scans from 100 flyers and fifty scans from 5,000 flyers mean different things. GhostQR records the scans; you supply the distribution counts.
Add campaign parameters to the destination URL if your website analytics supports them. This helps connect a QR visit with later actions on your own site.
| Placement | Copies | Scans | Scans / 100 copies |
|---|---|---|---|
| Takeaway flyers | 1,000 | 197 | 19.7 |
| Event handouts | 2,000 | 120 | 6.0 |
Calculate 197 ÷ 1,000 × 100 = 19.7 scans per 100 copies. The takeaway flyers produced more scans per copy in this example. This is not a conversion rate: repeat scans can count more than once, and a distributed copy does not prove someone saw it. Distribution counts and this calculation are supplied by you, outside GhostQR.
A scan is not a sale
A visit to a short link does not prove that someone read the destination page or bought something. Opening the short link directly, testing your own code, and automated requests can also create activity.
Unique-scanner counts use a daily rotating pseudonymous identifier. They are an estimate, not a count of identified people: one person returning on another day may be counted again, and shared connections can affect the estimate.
Use scan trends alongside your website's conversions and the context of your campaign. See the privacy policy for the data collected and how it is handled.
Start with one clear question
For example: does a counter sign bring more visitors to your booking page than a flyer? Create a code for each, test both prints, and compare their activity over a week.
Create a dynamic code or compare plans. If the campaign's destination changes, you can update the link without reprinting.